Understanding Changes in Global Extreme Precipitation Using Machine Learning
Project Members
Nicole Keeney, Frances Davenport
Study Areas
Global
Climate change is intensifying the global water cycle. The frequency and severity of hydroclimatic extremes, including flooding, extreme precipitation, and drought, has increased in recent history and is projected to continue increasing due to climate change. However, climate models struggle to characterize precipitation, especially extreme precipitation, posing challenges for understanding how, where, and why flooding and severe precipitation are expected to change in the coming decades.How can we study future flooding and severe precipitation in a warming world if climate models– our main tool for understanding future climate change– aren't able to accurately model precipitation extremes? Our research project approaches this problem using a bit of cleverness, a lot of data, and the help of artificial intelligence.
One thing climate models do quite well is represent large-scale atmospheric circulation patterns, i.e. changing pressure levels that create weather at the Earth’s surface and transfer thermal energy in the atmosphere. Atmospheric circulation is the driving force behind weather systems that cause severe precipitation and flooding. Our research approach involves leveraging this relationship between atmospheric circulation and extreme precipitation to study extreme precipitation in a warming world. The basic idea is as follows: First, we train a model to learn the dominant atmospheric circulation patterns that have historically driven extreme precipitation. Then, we use the relationships learned by the model to understand how extreme precipitation will change in the future using estimates of atmospheric circulation patterns from climate model projections. Using this method, we bypass the need to look at climate model projections of precipitation– avoiding the uncertainties that have historically blocked a robust understanding of this topic.

How exactly are we doing this? That’s where artificial intelligence comes in– specifically, convolutional neural networks (CNNs), a type of machine learning model. CNNs are commonly used for image classification and object recognition because they can detect complex relationships between pixels. For example, a CNN could be used to recognize individual people in a photo library by learning unique facial features for each person. They are also becoming an increasingly popular tool in atmospheric and earth sciences because they can be applied to satellite and climate model data, which can be thought of as images with pixels.
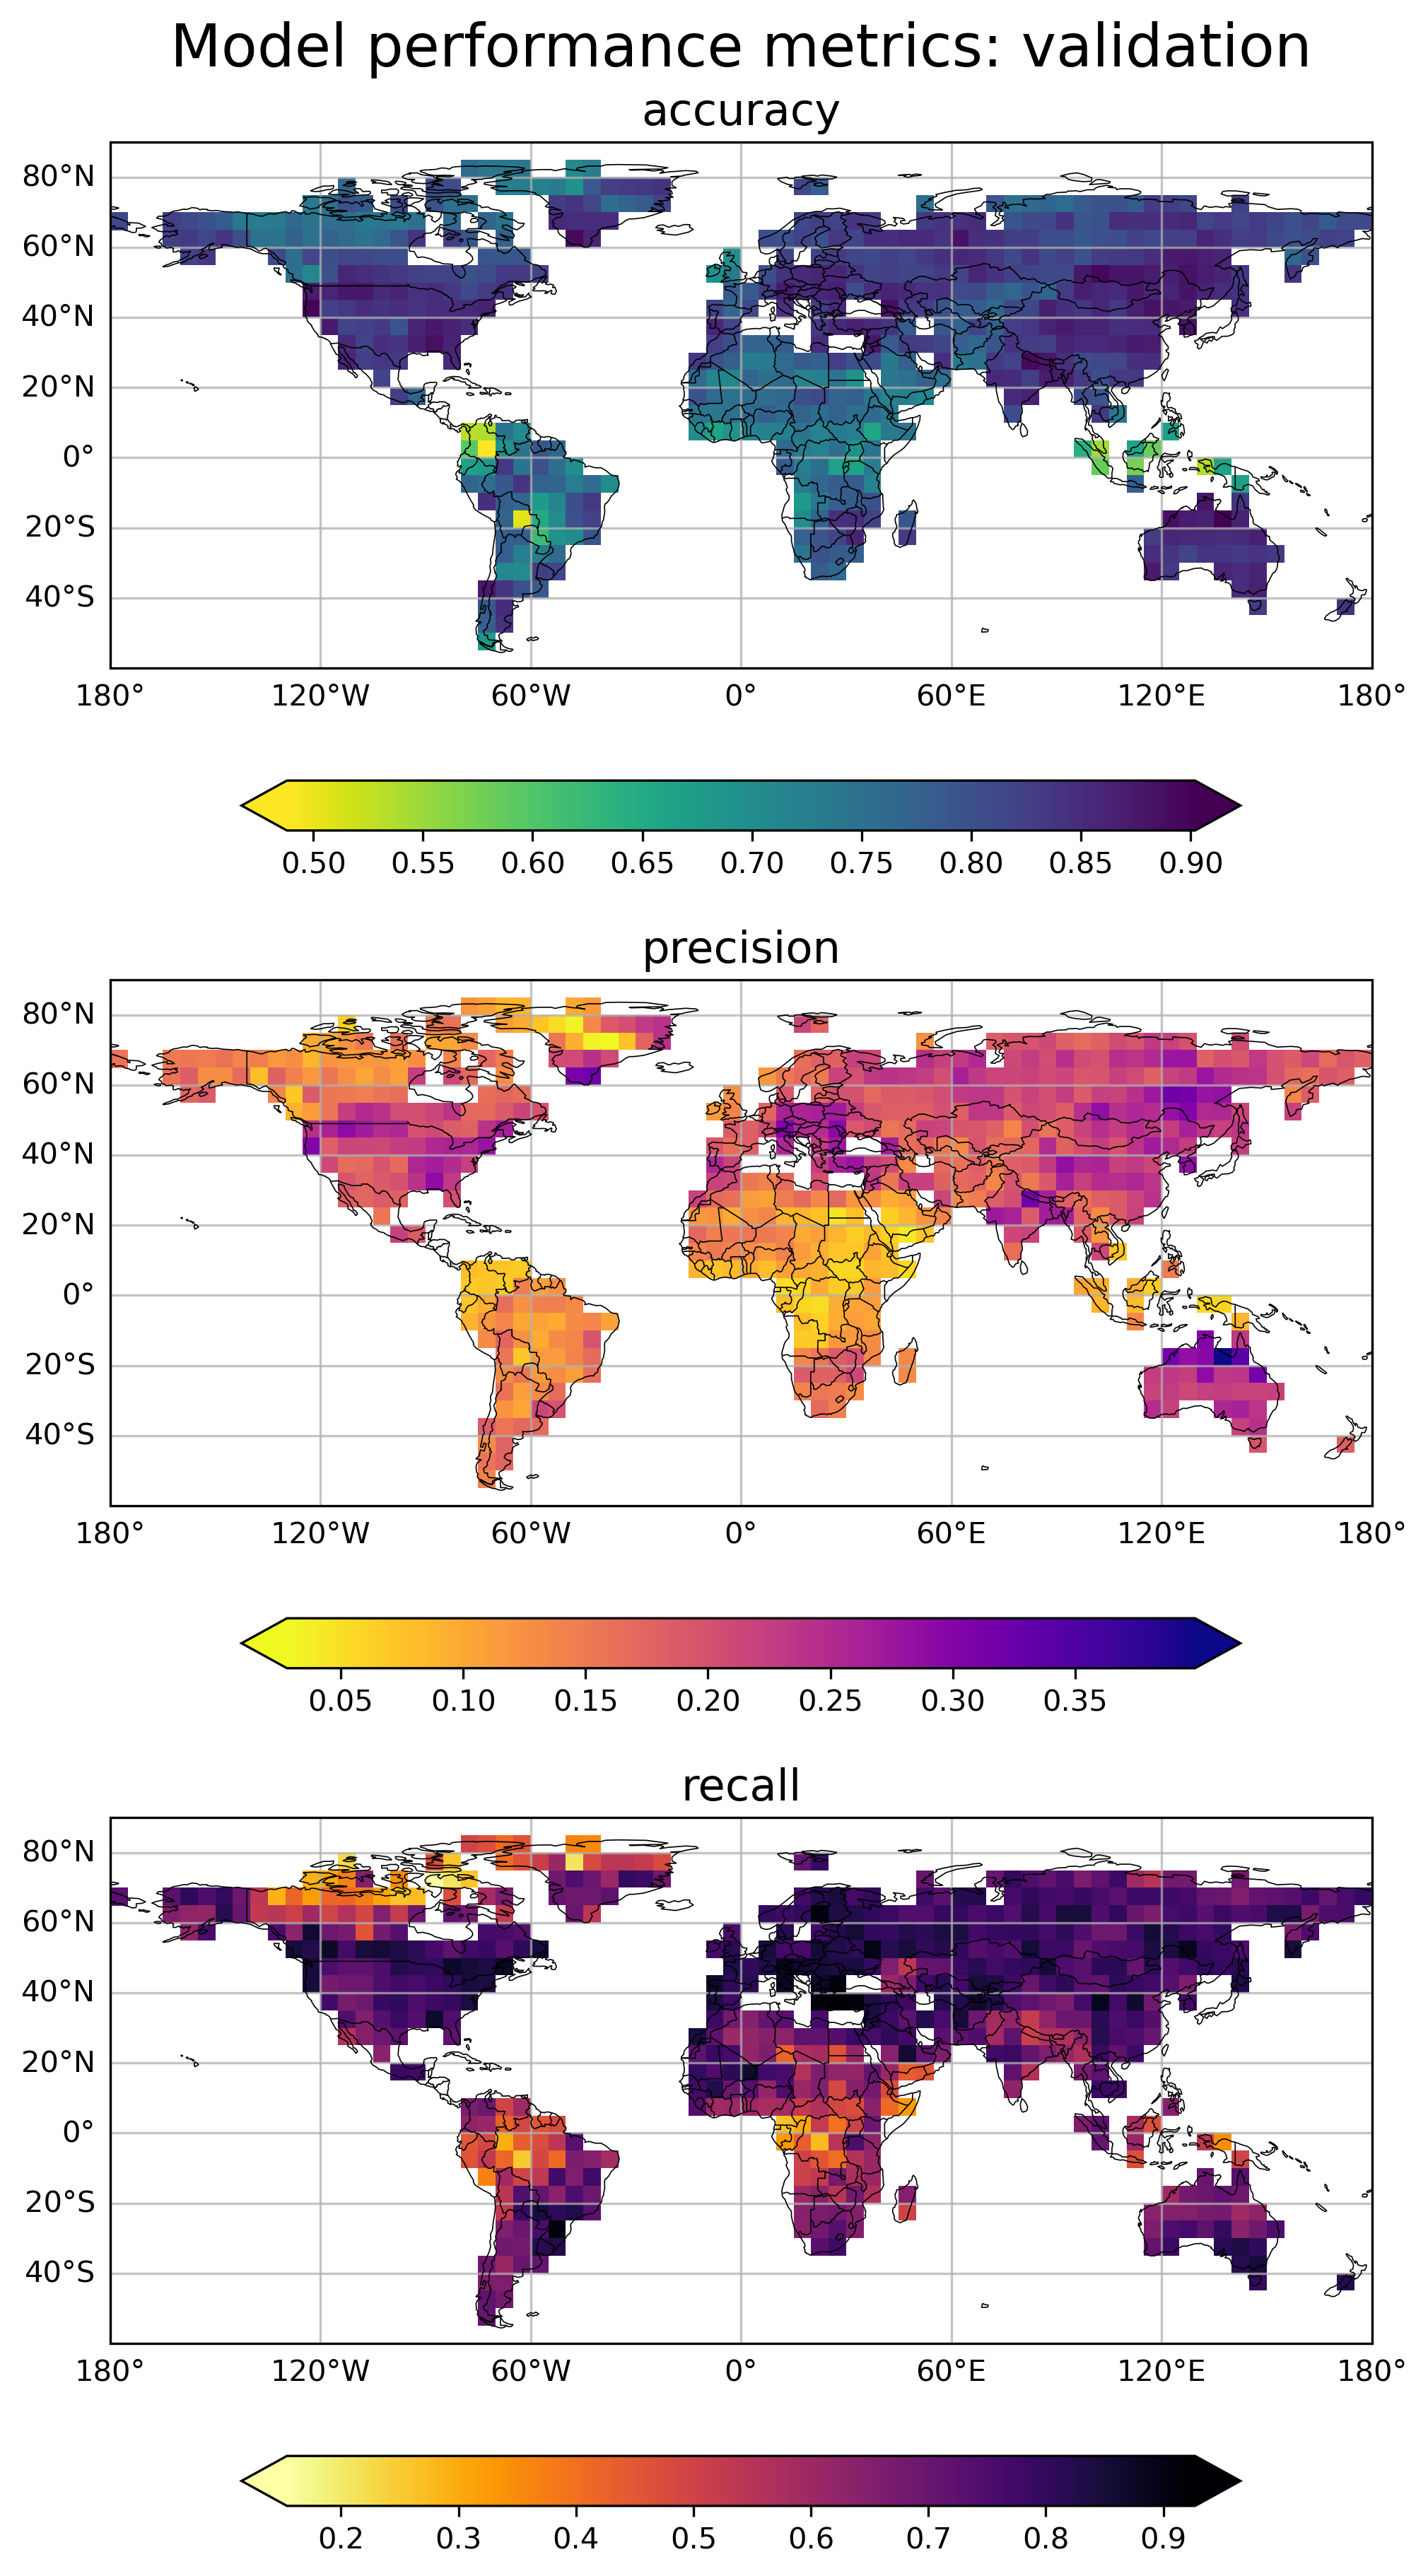
For this project, we train a series of CNNs to predict extreme precipitation using historical climate data. “Historical” refers to the period in recent history in which we have satellite and in-situ (from ground monitors) data; for our purposes, from 1980 to the present. Our study region is the entire globe, and we train a unique CNN for each gridcell (i.e. “pixel”) on the planet representing different regions, at different spatial resolutions. A unique CNN is needed for each gridcell because weather patterns in different regions of the globe are influenced by atmospheric circulation patterns unique to that region; i.e. we wouldn’t expect extreme precipitation in Canada to be influenced by the same circulation patterns as extreme precipitation in Brazil, so each region needs its own CNN.
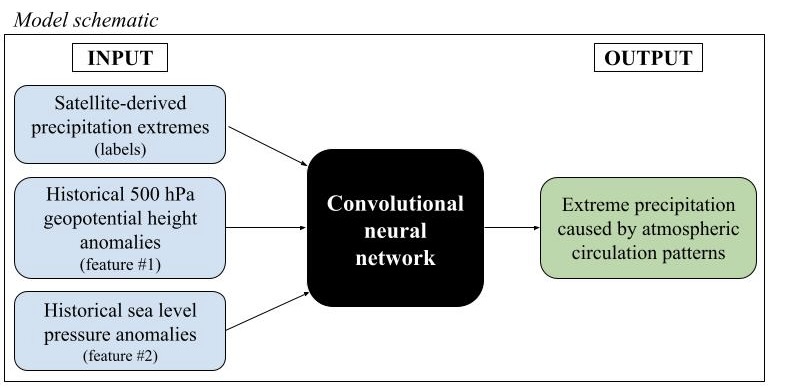
To represent large-scale atmospheric circulation, we use two pressure variables: geopotential height at 500 hPa and sea level pressure (in plain language: the atmospheric pressure in the troposphere and at Earth’s surface). We then compute the daily standardized anomalies of both pressure variables, thus removing the influence of seasonal variability that would otherwise water down the day-to-day variability in the variables that we are actually interested in.
We use a supervised method to train the model, so we also feed the model the information about precipitation extremes from historic precipitation measurements from satellites. Precipitation extremes are computed as the 95th percentile of daily precipitation; i.e. an “extreme precipitation day” is any day in which the measured precipitation is 95% higher than the mean precipitation for that region. Using all this data, a CNN for each region is trained to learn the dominant atmospheric circulation patterns associated with extreme precipitation.

Inputs and outputs to our Convolutional Neural Network.
Finally, we can use each trained CNN to understand precipitation extremes in the future. We feed our trained CNNs climate model projections of geopotential height at 500hPa and sea level pressure for the future period (present day - 2100). The CNN, which has learned the dominant atmospheric circulation patterns that cause extreme precipitation, can then predict extreme precipitation days for the future period using only the pressure inputs.
The analysis from this research project will address the following questions:

Prelinary results from our model for a region in the United States, represented by the star (which is the center of the grid cell for that region). This figure shows pressure level anomalies associated with extreme precipitation events in that region. EPCP stands for "Extreme Precipitation Circulation Patterns".
Related Publications
Davenport, F. V., & Diffenbaugh, N. S. (2021). Using Machine Learning to Analyze Physical Causes of Climate Change: A Case Study of U.S. Midwest Extreme Precipitation. Geophysical Research Letters, 48(15), e2021GL093787. https://doi.org/10.1029/2021GL093787
